 Screenshot using the 2008 model.
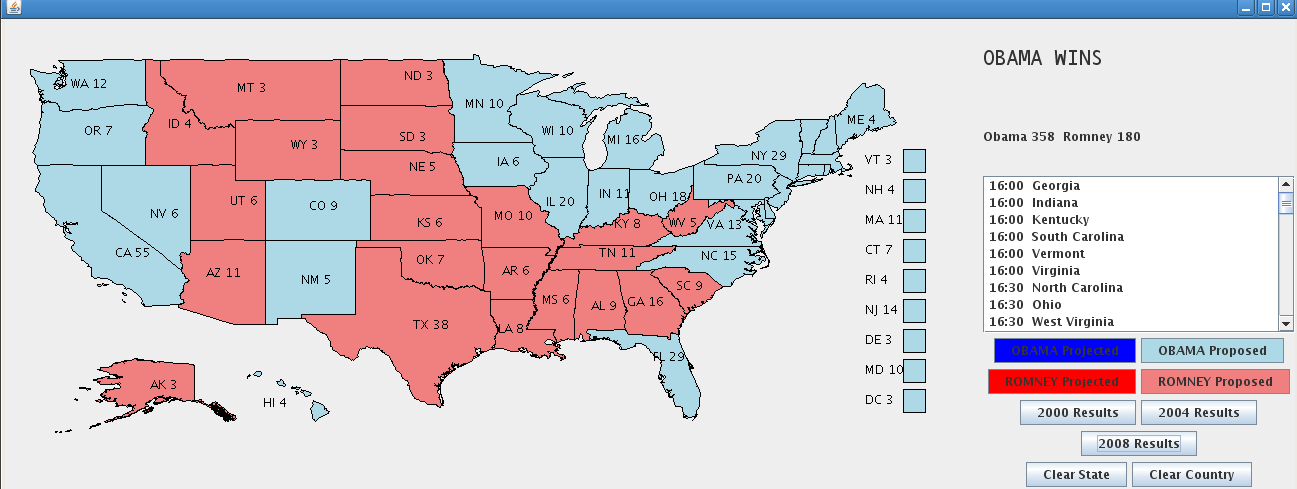
This application is designed as an election night tool to enable tracking the state-by-state results in a graphical manner to aid interpretation of the overall picture. It requires the installation of Java.
Screenshot using the 2008 model.
Download
ElectionMap, run via java -jar ElectionMap
You can assign the electoral votes of a state in either of two ways. The darker colors represent "official" assignment, which you click once a news report you trust has projected that state. The lighter colors represent speculative results. You can superimpose the results of the 2000, 2004, and 2008 elections, overwriting the value in all states that have not been officially assigned. Clicking the 2000, 2004, 2008, and "Clear Country" buttons work immediately. Others require you to then click on one or more states.
There is a list of poll closing times for each state in the time zone of the user. Once the polls have closed in a state it is removed from the list.
The odds are extremely high of the Republican Party maintaining control of the House of Representatives so Mitt Romney is declared the winner upon receipt of 269 electoral votes, while Barack Obama requires 270.
Nebraska (5 EV) and Maine (4 EV) do not award their electoral votes via winner-take-all. The overall state winner receives 2 electoral votes, and then each congressional district awards its electoral vote individually. This is not modeled, but has never resulted in a net difference of more than 1.
Map data was taken from http://www.mccurley.org/svg/data/states.svg.
There is no license associated with this software. Do with it what you will, but please cite Charles Walter as the developer.